¶ LuData PV Yield — Benchmark & Comparison
LuData PV Yield has been benchmarked against PVsyst across three anonymized utility-scale PV configurations: floating PV, single-axis tracking and fixed-tilt PV.
This comparison was created in response to a recurring question from teams evaluating LuData:
How does the LuData PV Yield modelling chain compare with PVsyst when both are applied to comparable project configurations and assumptions?
Technical reference access
The complete underlying PVsyst reference reports and detailed benchmark inputs are retained by LuciSun for traceability and reproducibility. They are not distributed directly on the public wiki because they contain project-specific engineering details that are not necessary to interpret the public benchmark.
Technical reviewers who require the reference material to reproduce or audit the comparison may request access through LuciSun Support by selecting General Inquiry, or contact Babacar Sarr, Head of Products, at babacar.sarr@lucisun.com.
What to remember
- 3 different utility-scale configurations
- 3/3 annual energy results within 1.8% of the corresponding PVsyst reference
- Monthly energy nMAE between 1.60% and 2.86%
- Agreement is assessed not only on final annual energy, but also through GHI, GTI, PR, monthly behaviour and the main loss chain
This is a technical benchmark and comparison, not a validation against measured plant performance. PVsyst is used as an established industry modelling reference. The purpose is to give users a transparent basis for judging how closely the LuData PV Yield chain behaves across representative project types.
¶ Results at a glance
| Metric | Site A — Floating PV | Site B — Tracker | Site C — Fixed tilt |
|---|---|---|---|
| Annual energy Δ | −1.74% | −1.60% | −0.69% |
| Annual PR Δ | −1.07 pt | −0.82 pt | +0.36 pt |
| Annual GHI Δ | +0.00% | −0.05% | +0.00% |
| Annual GTI Δ | −0.51% | −0.64% | −1.12% |
| Monthly energy nMAE | 2.86% | 1.60% | 1.94% |
Across floating PV, single-axis tracking and fixed-tilt configurations, the complete LuData modelling chain produces annual energy estimates within 1.8% of the PVsyst reference in every benchmark case.
The three cases also provide different comparison conditions:
- Site A: same meteorological series and effectively identical annual GHI; the comparison therefore focuses strongly on transposition and the downstream PV modelling chain.
- Site B: closely aligned meteorological inputs and Hay transposition in both simulations, providing the most direct downstream comparison.
- Site C: effectively identical annual GHI, but a different transposition result; the remaining downstream chain partially compensates for the GTI difference.
¶ Reference material, traceability and reproducibility
The benchmark is based on complete PVsyst reference simulations and documented LuData configurations. The underlying reference files are preserved by LuciSun as part of the benchmark audit trail.
The full PVsyst project reports are not made available as direct public downloads on this page. This is a deliberate publication choice: the public benchmark contains the information required to understand the methodology, comparison conditions and results, while the original reports include additional project-specific engineering details that are not necessary for that purpose.
This approach preserves both:
- public transparency, through the documented assumptions, modelling choices, annual and monthly comparison metrics, and loss-chain analysis presented below;
- technical reproducibility, through controlled access to the underlying reference material for reviewers who need to reproduce or audit the benchmark in greater depth.
¶ Request the reference material
Technical reviewers may request access to the detailed reference package, including the relevant PVsyst report information and the inputs required to reproduce the benchmark:
- LuciSun Support → select General Inquiry
- Babacar Sarr — Head of Products: babacar.sarr@lucisun.com
Requests are handled directly by the LuData team so that the appropriate technical material and context can be provided.
- Document reference:
LUDATA-PVY-BENCH-2026-01 - Issue date: 20 August 2026
- Publication status: Public benchmark page
Client names, plant names, exact coordinates and identifiable project visuals are omitted from the public benchmark. Geographic information is intentionally limited to a broad regional and climatic context.
¶ Why compare with PVsyst?
PVsyst is widely used as an engineering reference in utility-scale PV development, technical due diligence and bankability-oriented studies.
The purpose of this comparison is not to claim that matching another model proves absolute accuracy. Both LuData and PVsyst remain modelling tools, and differences can legitimately arise from:
- irradiance decomposition and transposition;
- shading treatment;
- thermal modelling;
- module behaviour;
- inverter conversion and clipping;
- the way individual losses are defined or grouped.
The purpose is to determine whether LuData produces engineering-consistent results relative to an established modelling workflow, while preserving the calculations that are independently performed by LuData.
¶ Benchmark scope
Three anonymized utility-scale reference configurations were selected to cover materially different PV architectures and operating environments.
| Site | Location / climate | PV configuration | Approx. system size | Meteorological basis |
|---|---|---|---|---|
| Site A | Western Europe · Temperate climate | Floating PV · Monofacial · Fixed tilt | ~3 MWp | LuData TMY P50 |
| Site B | Southern Europe · Mediterranean climate | Single-axis tracker · Monofacial · N–S horizontal axis | ~25 MWp | PVGIS TMY uploaded |
| Site C | Western South America · High-irradiance arid climate | Ground-mounted · Monofacial · Fixed tilt | ~10 MWp | SolarGIS TMY P50 uploaded |
The objective was deliberately not to demonstrate agreement on one favourable project.
- Site A — Floating PV tests a low-tilt floating configuration under moderate irradiation.
- Site B — Single-axis tracker introduces dynamic orientation, backtracking and tracker-related shading.
- Site C — Fixed-tilt desert PV provides a high-irradiance case with different thermal and electrical operating conditions.
¶ What was actually compared?
A useful model-to-model comparison requires two things at the same time:
- both simulations must represent the same reference configuration and engineering assumptions as closely as possible;
- the modelling stages intended to be compared must remain independently calculated.
The benchmark therefore aligns directly transferable project inputs, while LuData retains its own calculations for the main physical stages of the yield chain.
¶ Aligned inputs and independent calculations
| Benchmark element | Treatment in the comparison |
|---|---|
| Plant DC / AC capacity | Matched to the reference configuration |
| Module and inverter characteristics | Reproduced as closely as possible from the available reference and manufacturer information, including PAN / OND information when available |
| System geometry / orientation | Matched to the reference configuration |
| Meteorological data | Same meteorological series used where available; remaining differences explicitly reported |
| Fixed / user-defined losses | Reproduced where directly transferable and relevant |
| LID, availability and similar assumptions | Aligned where appropriate |
| Soiling / snow | Annual reference loss aligned for these benchmark runs; LuData automatic assessment methods were intentionally not used |
| IAM | Annual PVsyst effect aligned for the benchmark |
| Irradiance decomposition / transposition | Calculated through the LuData modelling chain |
| Far-horizon effect | Calculated through the LuData modelling chain |
| Inter-array shading | Calculated through the LuData modelling chain |
| Module temperature | Calculated through the LuData modelling chain |
| Irradiance-level module behaviour | Calculated through the LuData modelling chain |
| Inverter conversion and clipping | Calculated through the LuData modelling chain |
| Final PV production and PR | Independently calculated by LuData and compared with PVsyst |
The benchmark was not tuned until LuData reproduced PVsyst. Independently calculated differences were retained and traced through the modelling chain.
¶ How to read the figures
For each benchmark case below, the information is presented in the same order:
- Main annual result — the headline numerical comparison;
- Cumulative annual loss chain — the clearest visual overview of how both simulations progress toward the final PR;
- Monthly behaviour — a check that the annual result is also reflected through the year;
- Technical detail — annual loss breakdown — the individual loss terms for readers who want to audit the differences.
The cumulative loss-chain figures are an illustrative mapping of annual effects. They are intended to compare the overall loss structure and should not be interpreted as an exact reconstruction of either software's internal calculation order. The reported annual PR remains the reference final performance indicator.
¶ Site A — Floating PV
¶ Why this case matters
Site A represents a floating monofacial installation of approximately 3 MWp in Western Europe, under a temperate climate.
For the final benchmark run, LuData uses the same meteorological series as the PVsyst reference. Annual GHI is effectively identical, providing a like-for-like solar-resource basis before the plane-of-array conversion and downstream modelling stages.
Key comparison conditions:
- PVsyst and LuData capacities were matched to the same approximately 3 MWp reference configuration
- fixed orientation reproduced from the reference project
- identical floating-PV thermal coefficients
- selected soiling, LID, mismatch, wiring, auxiliaries and transformer assumptions aligned where appropriate
- IAM annual effect aligned
- far-horizon shading independently calculated by LuData
- inter-row shading independently calculated from array geometry
LuData also retains a separate fixed near-object shading contribution and keeps electrical partial-shading loss as a distinct term.
¶ Main annual result
| Metric | PVsyst | LuData | Difference |
|---|---|---|---|
| GHI [kWh/m²] | 1,130.2 | 1,130.2 | +0.00% |
| GTI [kWh/m²] | 1,212.5 | 1,206.3 | −0.51% |
| Energy to grid [MWh] | 3,199.2 | 3,143.4 | −1.74% |
| Specific yield [kWh/kWp] | 1,049 | 1,030.7 | −1.74% |
| PR | 86.52% | 85.45% | −1.07 pt |
Takeaway: with annual GHI effectively identical, LuData reaches annual energy 1.74% below the PVsyst reference and annual PR 1.07 percentage points below.
¶ Cumulative annual loss chain
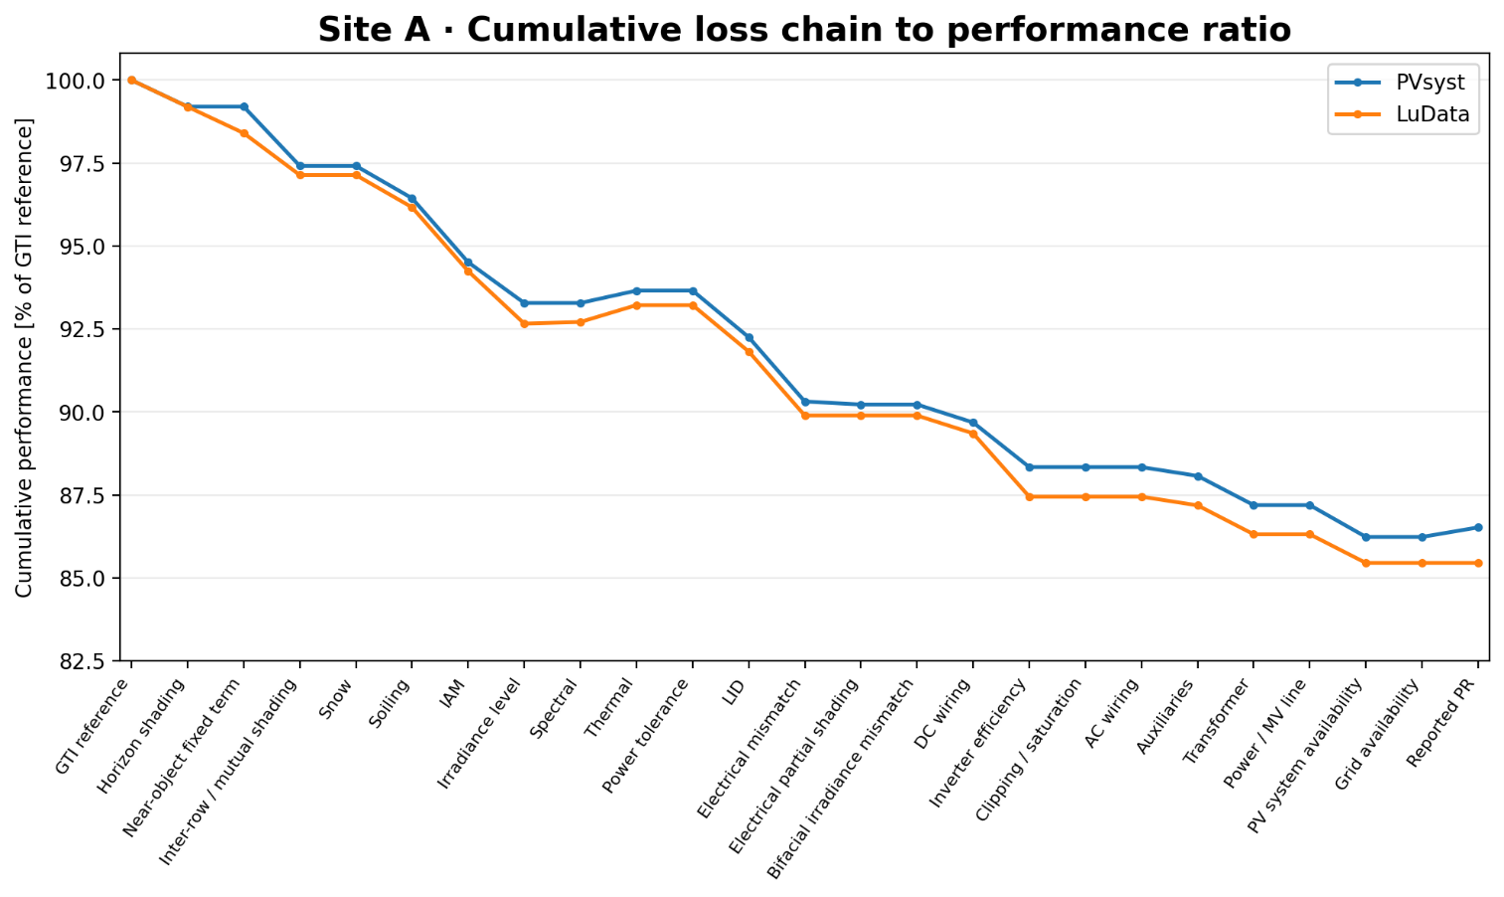
The cumulative profiles follow a similar overall loss pattern and finish at 86.52% PR for PVsyst and 85.45% for LuData.
¶ Monthly behaviour
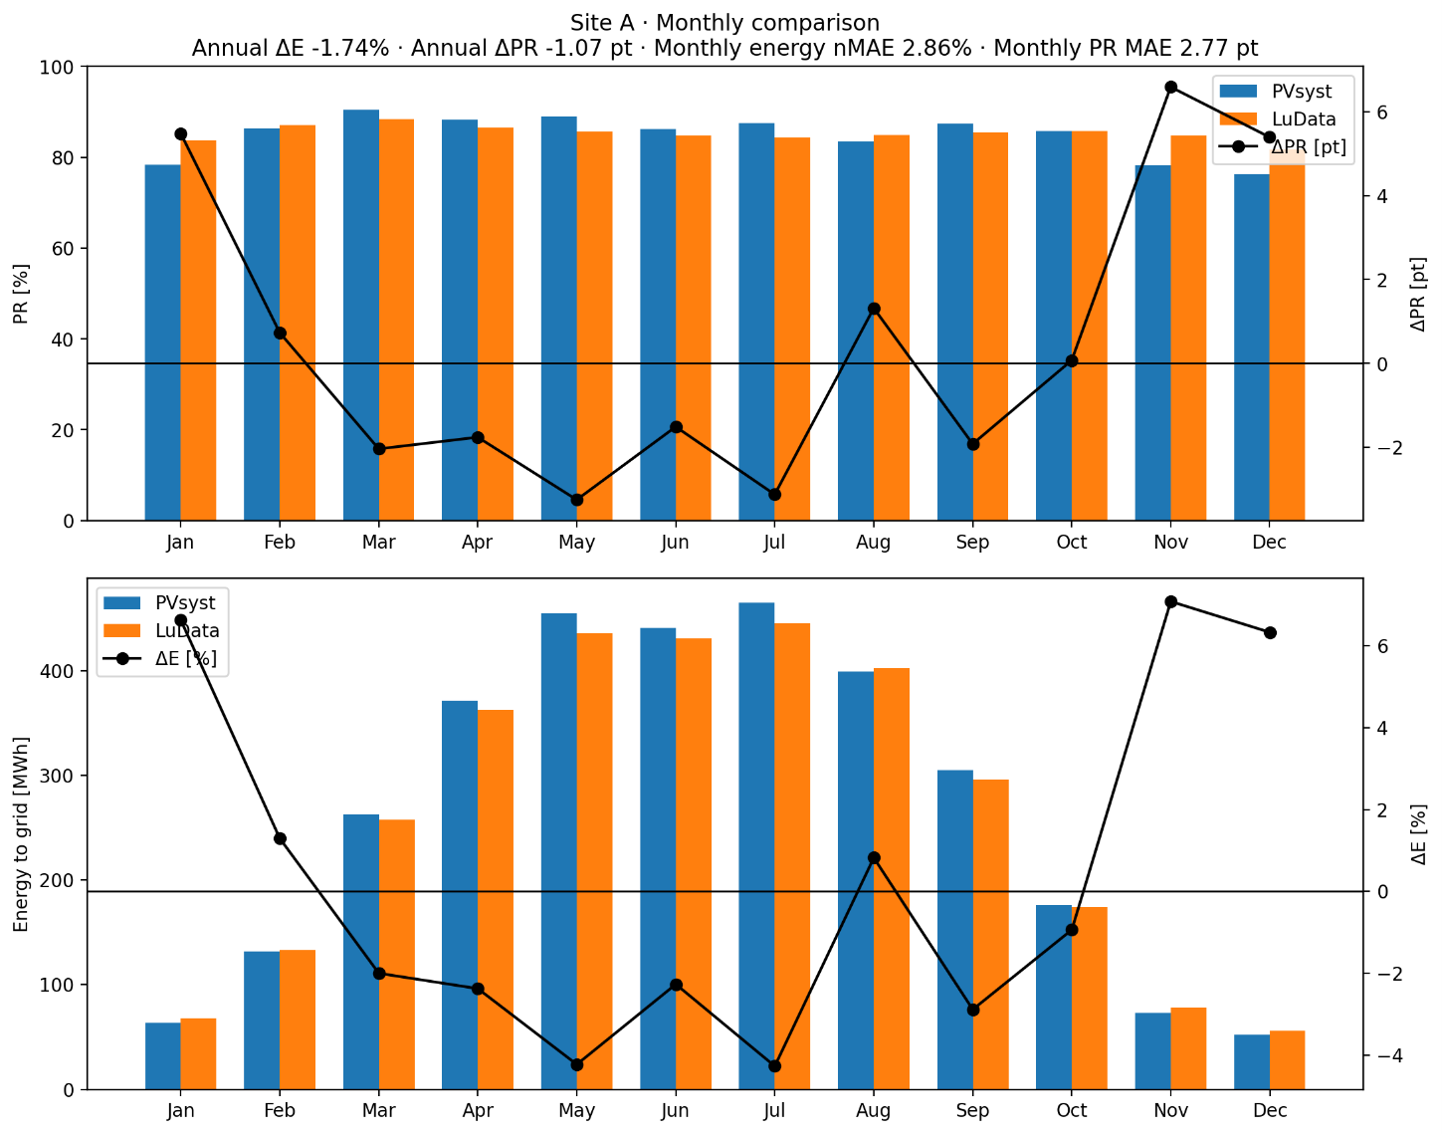
- Monthly energy nMAE: 2.86%
- Monthly PR MAE: 2.77 percentage points
- Annual energy difference: −1.74%
- Annual PR difference: −1.07 pt
Despite month-to-month differences, both simulations reproduce the same overall production seasonality.
¶ Technical detail — annual loss breakdown
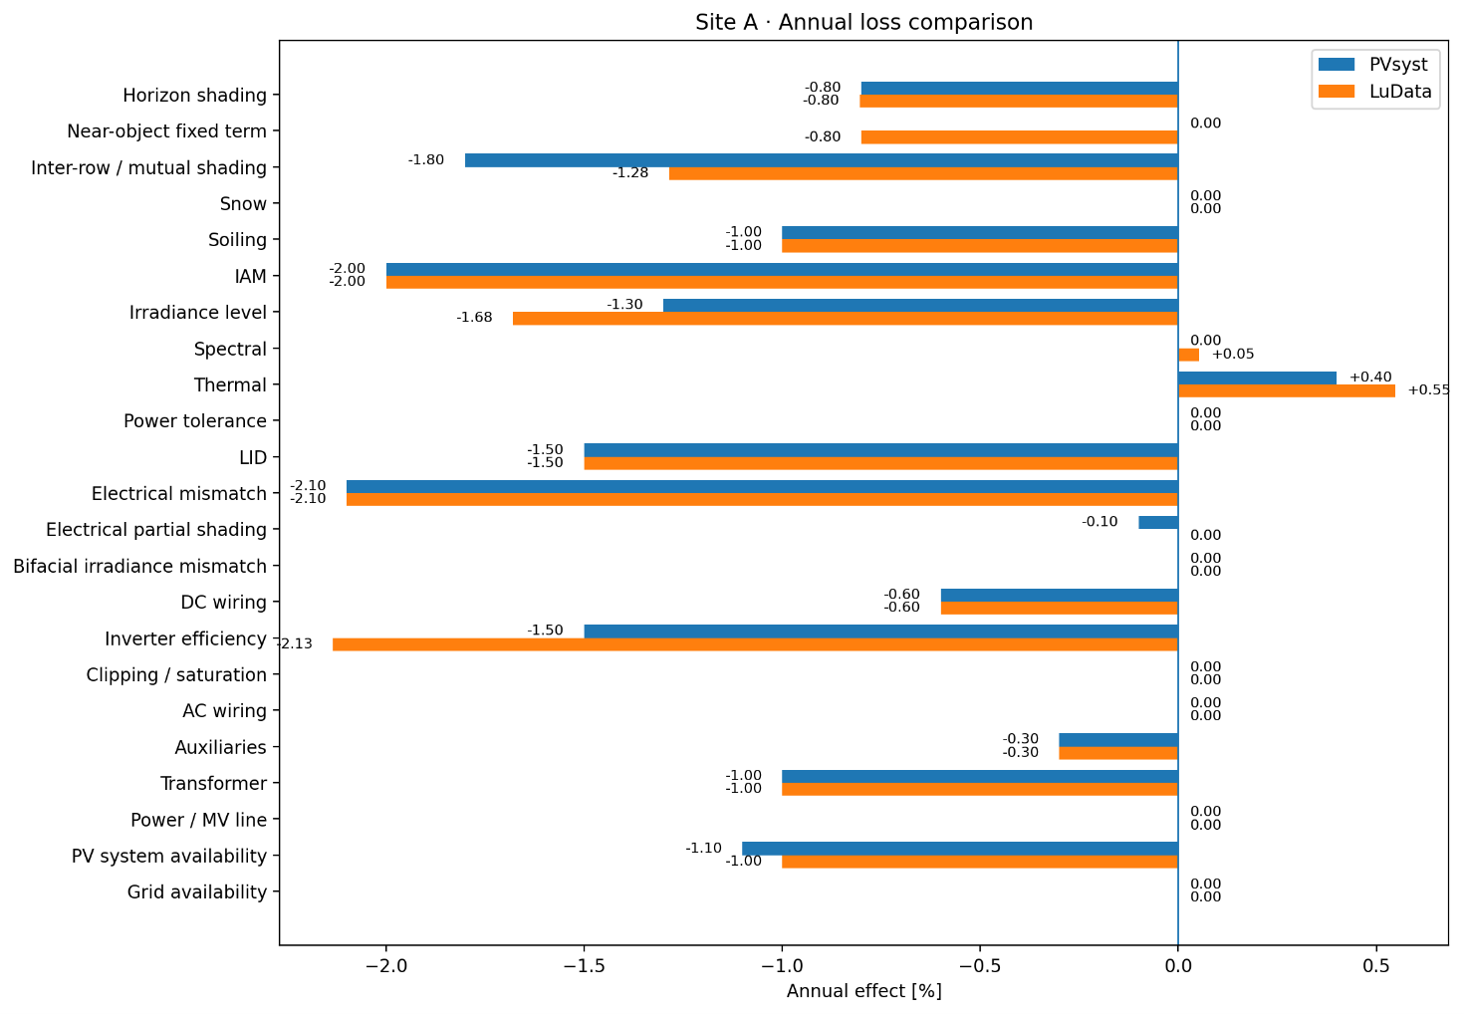
The detailed chart shows the aligned project assumptions alongside independently calculated effects such as horizon shading, inter-row shading, irradiance-level response, thermal behaviour and inverter conversion.
¶ Site B — Single-axis tracker
¶ Why this case matters
Site B represents a monofacial horizontal single-axis tracker installation of approximately 25 MWp in Southern Europe, under a Mediterranean climate.
This is the most direct of the three downstream comparisons:
- both simulations use the same PVGIS TMY meteorological basis;
- annual GHI differs by less than 0.1%;
- both simulations use Hay transposition;
- tracker geometry, rotation range and backtracking are represented in LuData;
- inter-row shading is calculated from tracker geometry rather than imposed as a fixed annual loss.
Selected soiling, IAM, LID, mismatch, wiring, auxiliaries, transformer and MV-line assumptions are aligned where appropriate. Thermal behaviour, spectral effects, tracker shading, inverter conversion and clipping remain calculated by LuData.
¶ Main annual result
| Metric | PVsyst | LuData | Difference |
|---|---|---|---|
| GHI [kWh/m²] | 1,506.9 | 1,506.2 | −0.05% |
| GTI [kWh/m²] | 1,945.9 | 1,933.5 | −0.64% |
| Energy to grid [MWh] | 40,980.0 | 40,323.7 | −1.60% |
| Specific yield [kWh/kWp] | 1,640 | 1,613.3 | −1.63% |
| PR | 84.26% | 83.44% | −0.82 pt |
Takeaway: with closely aligned resource input and the same transposition approach, LuData annual energy is 1.60% below PVsyst and annual PR is 0.82 percentage point below.
¶ Cumulative annual loss chain
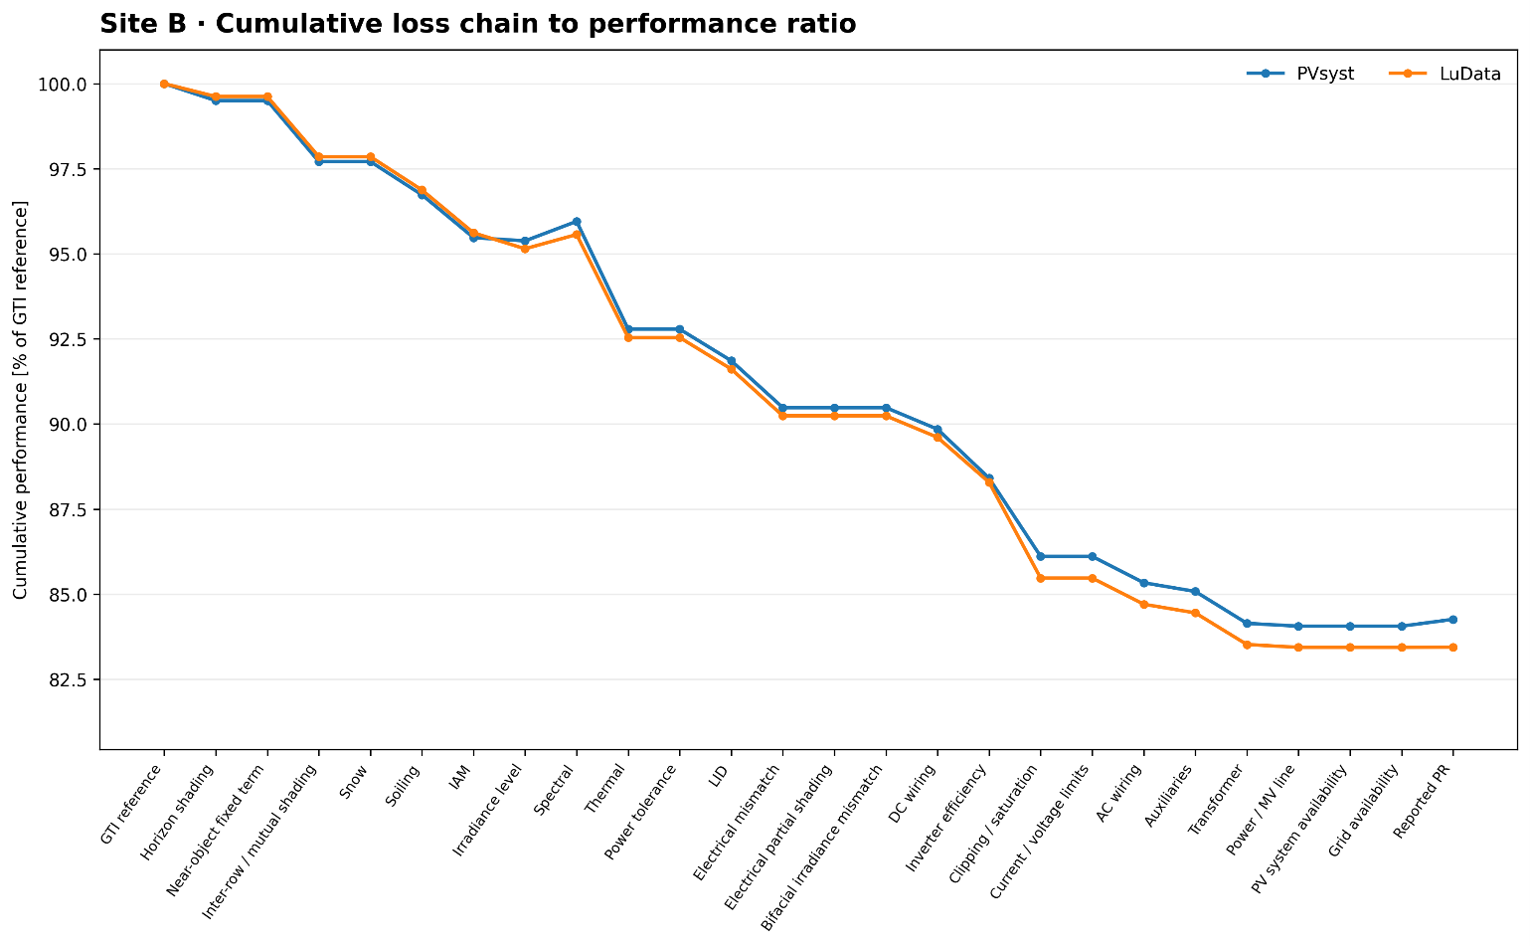
The cumulative loss profiles remain closely aligned through the principal conversion stages, consistent with the final annual energy and PR differences.
¶ Monthly behaviour
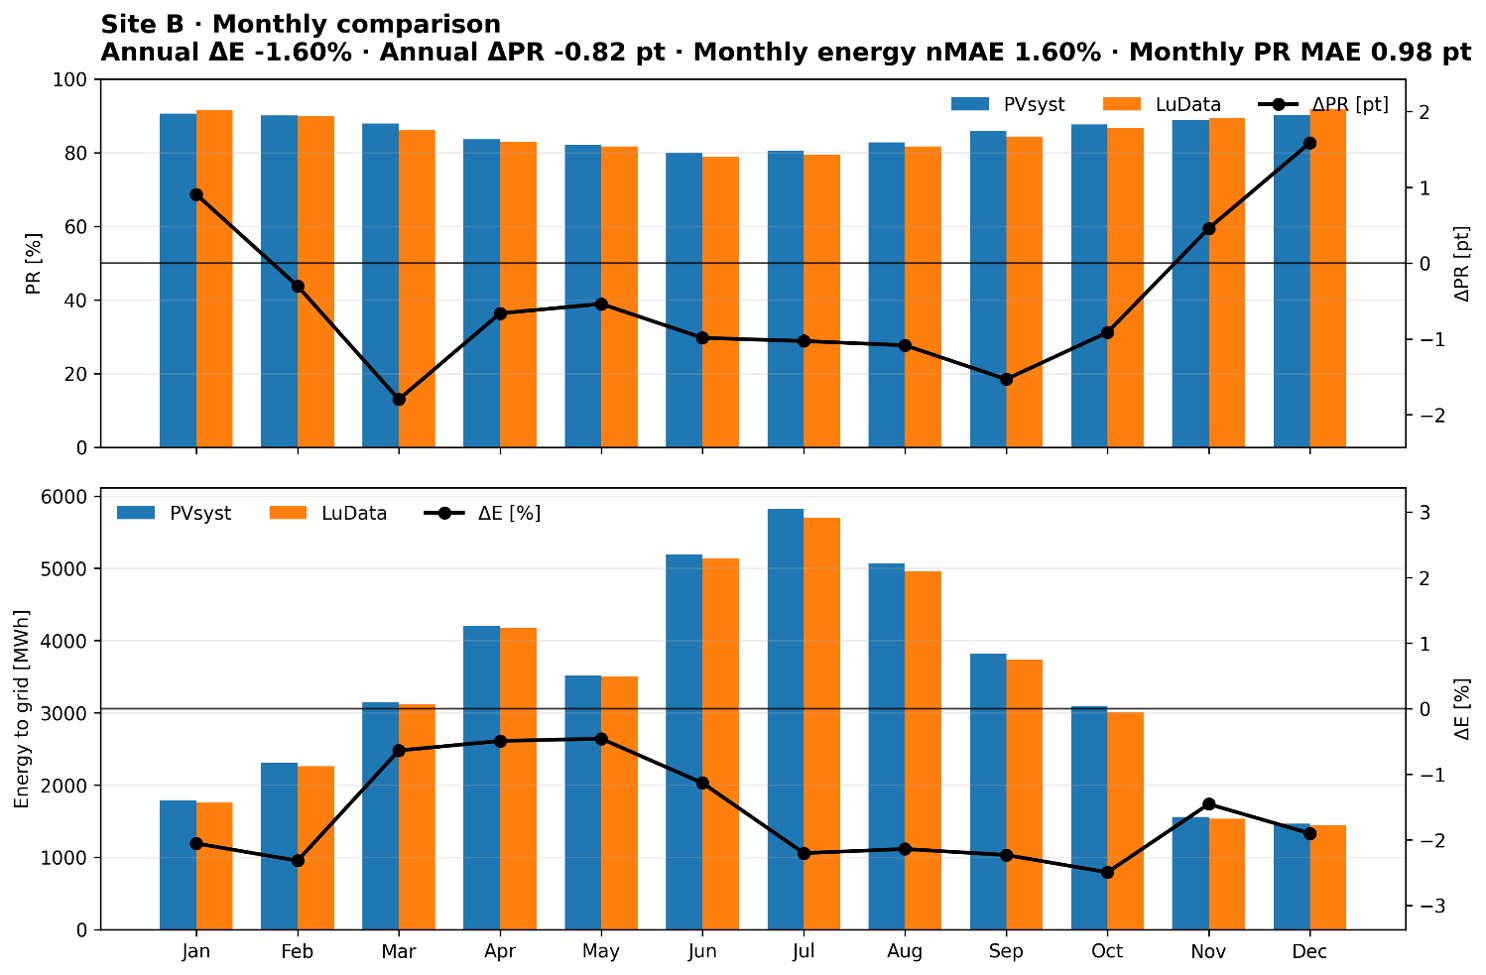
- Monthly energy nMAE: 1.60%
- Monthly PR MAE: 0.98 percentage point
- Annual energy difference: −1.60%
- Annual PR difference: −0.82 pt
The two simulations reproduce very similar monthly energy and performance profiles throughout the year.
¶ Technical detail — annual loss breakdown
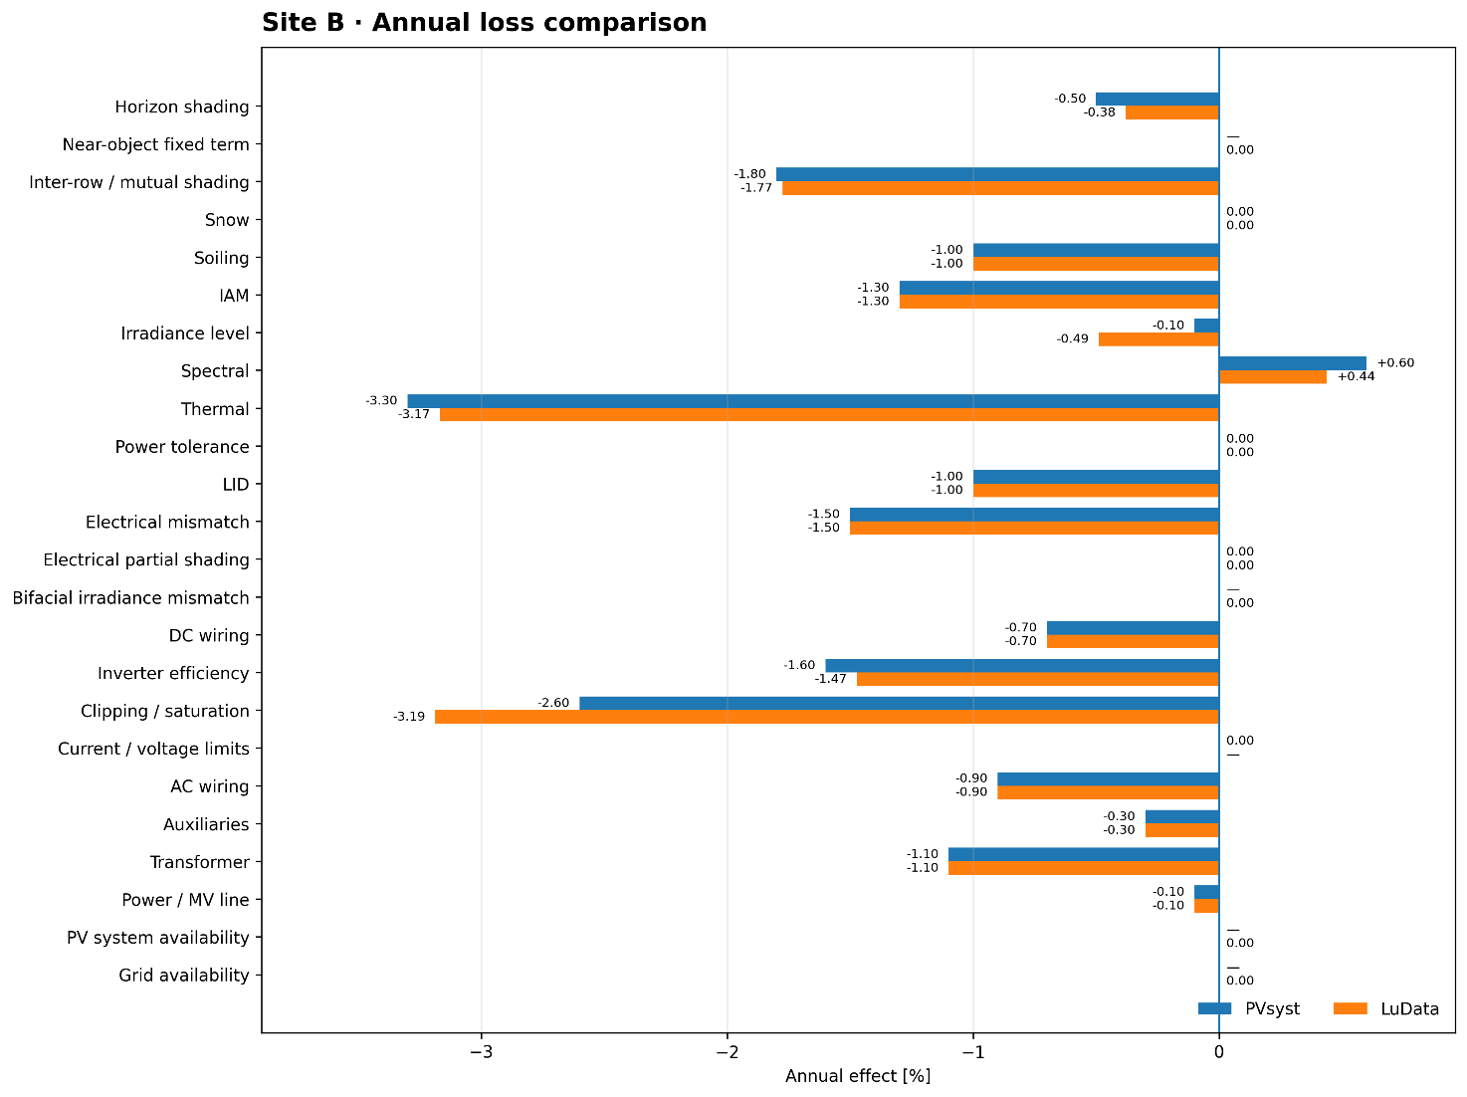
The detailed loss comparison shows close agreement for several major contributions, including inter-row shading, thermal losses, spectral effect, wiring, auxiliaries and transformer losses. The most visible remaining differences occur in independently calculated irradiance-level response and inverter clipping.
¶ Site C — Fixed-tilt PV
¶ Why this case matters
Site C represents a ground-mounted monofacial fixed-tilt installation of approximately 10 MWp in Western South America, under a high-irradiance arid climate.
The simulation uses the same SolarGIS TMY P50 meteorological basis as the reference project.
Annual GHI is effectively identical. The principal upstream modelling difference is therefore transposition:
- PVsyst: Perez
- LuData: Hay
Inter-row shading and thermal behaviour are calculated independently by LuData. Selected soiling, IAM, LID, mismatch, wiring, auxiliaries, transformer and availability assumptions are aligned where appropriate.
The high-irradiance environment also makes irradiance-level module behaviour and thermal response particularly relevant.
¶ Main annual result
| Metric | PVsyst | LuData | Difference |
|---|---|---|---|
| GHI [kWh/m²] | 2,523.4 | 2,523.5 | +0.00% |
| GTI [kWh/m²] | 2,790.0 | 2,758.6 | −1.12% |
| Energy to grid [MWh] | 21,212.0 | 21,066.1 | −0.69% |
| Specific yield [kWh/kWp] | 2,232 | 2,217.0 | −0.67% |
| PR | 80.01% | 80.37% | +0.36 pt |
Takeaway: LuData GTI is 1.12% lower, while its annual PR is 0.36 percentage point higher. These effects partially compensate, leaving final annual energy only 0.69% below the PVsyst reference.
¶ Cumulative annual loss chain
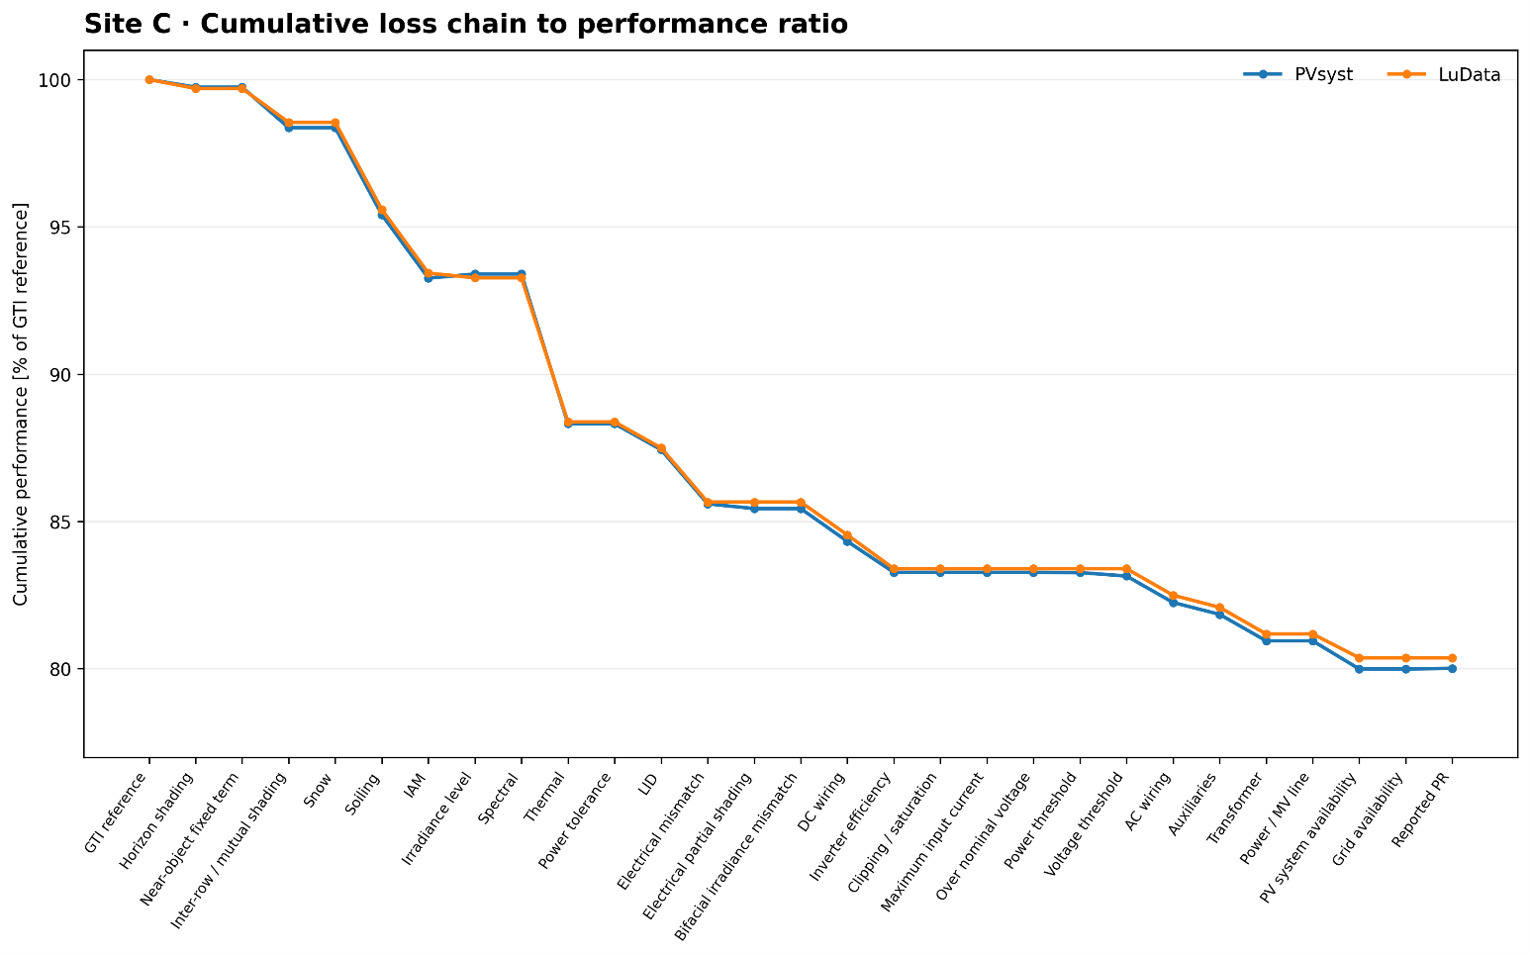
The cumulative profiles remain closely aligned at annual level and finish at 80.01% PR for PVsyst and 80.37% for LuData.
¶ Monthly behaviour
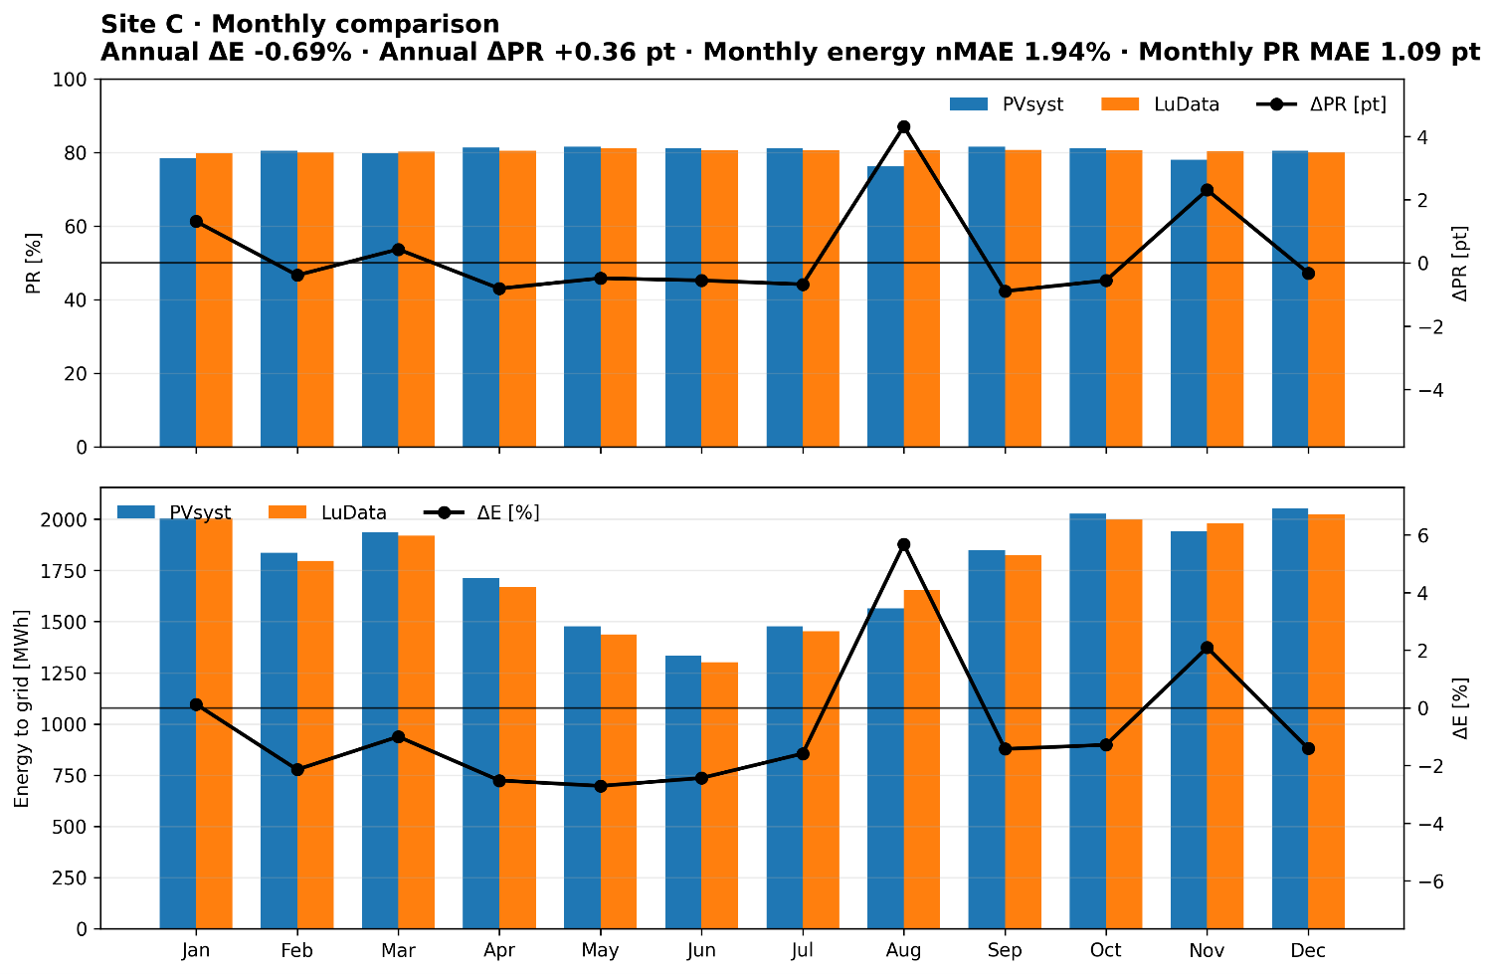
- Monthly energy nMAE: 1.94%
- Monthly PR MAE: 1.09 percentage point
- Annual energy difference: −0.69%
- Annual PR difference: +0.36 pt
The comparison shows close agreement in both the magnitude and seasonal evolution of PV production.
¶ Technical detail — annual loss breakdown
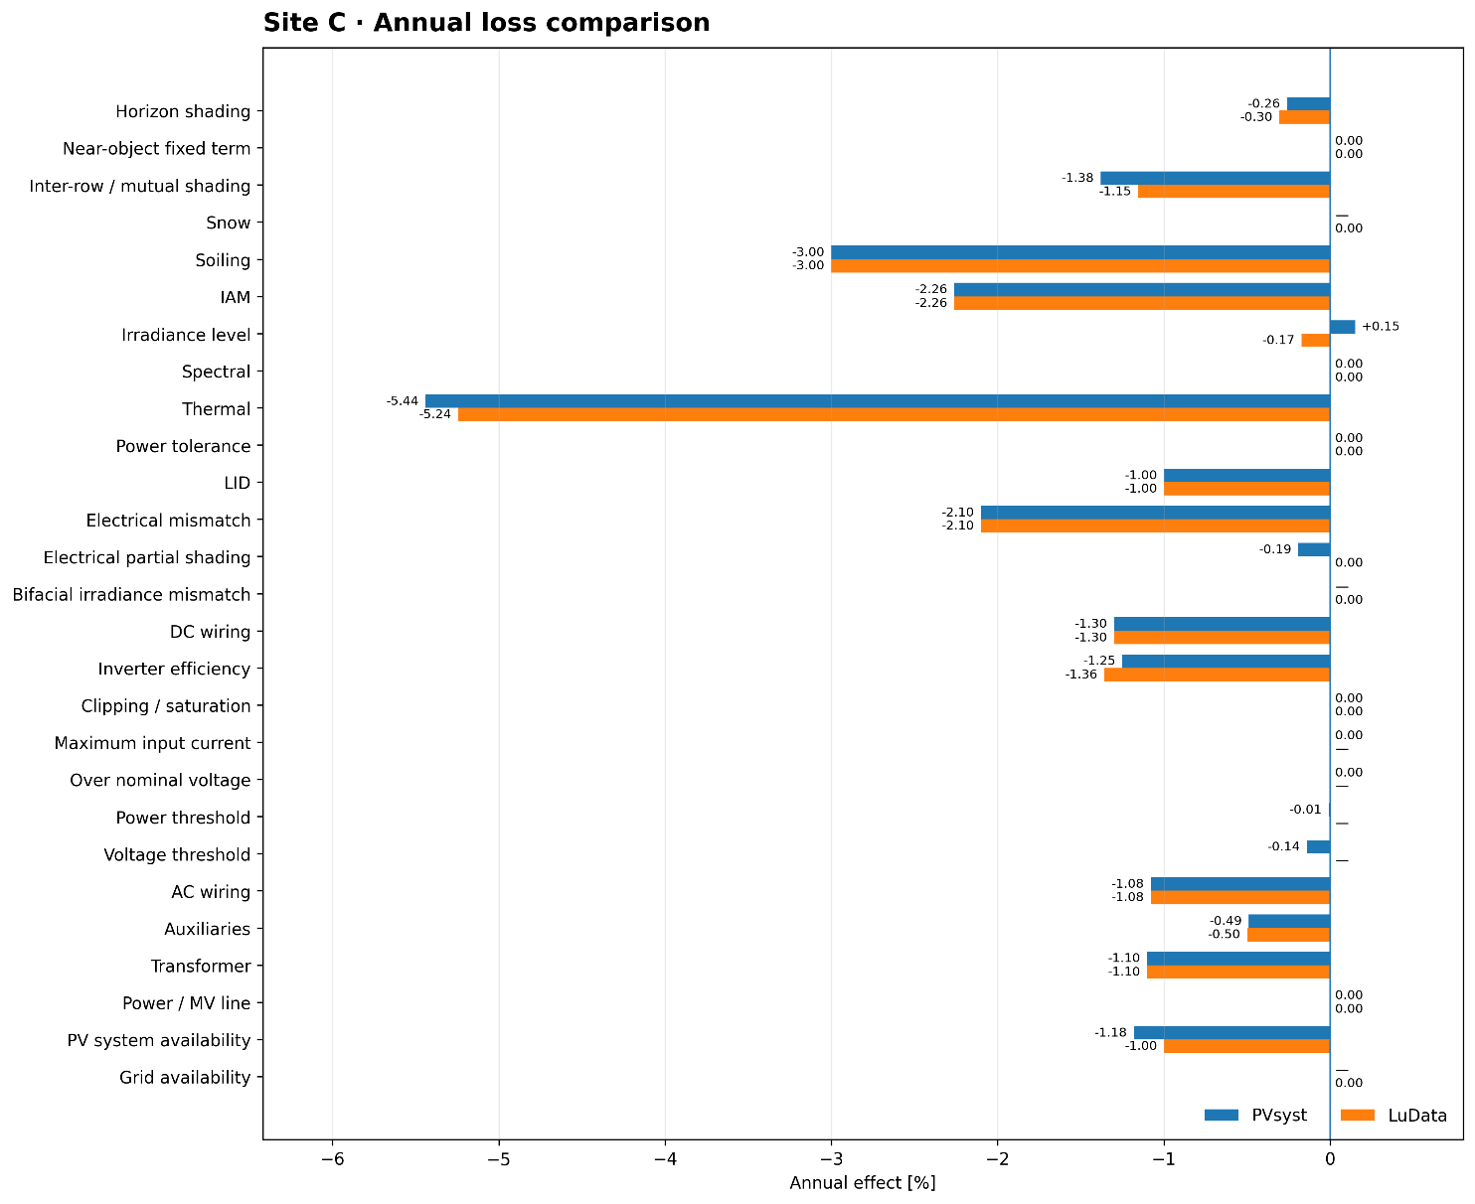
The detailed comparison shows close agreement for major thermal, soiling, IAM, mismatch, wiring and transformer contributions. Differences remain in some independently calculated terms, particularly irradiance-level module behaviour and electrical shading treatment.
¶ Overall interpretation
The three cases are intentionally complementary:
| Case | Main comparison condition | Annual energy Δ |
|---|---|---|
| Site A | Same meteorological series; effectively identical GHI | −1.74% |
| Site B | Closely aligned meteo + same Hay transposition | −1.60% |
| Site C | Effectively identical GHI + different transposition result | −0.69% |
No adjustment was applied to force independently calculated LuData outputs to reproduce PVsyst.
Across all three sites:
- annual energy remains within 1.8% of the reference;
- monthly energy nMAE remains between 1.60% and 2.86%;
- annual PR differences remain between −1.07 and +0.36 percentage points;
- the month-to-month production profiles retain closely comparable seasonal behaviour.
The comparison therefore supports the conclusion that the close annual results are not simply isolated final-energy matches: they are also reflected in the cumulative loss behaviour and monthly production profiles.
¶ What LuData adds to the PV Yield workflow
The benchmark addresses one specific confidence question. LuData PV Yield is designed for a broader engineering workflow than a single annual yield calculation.
¶ Interactive engineering workflow
Engineering teams can configure projects, select modelling approaches, run simulations and inspect results directly in the web interface.
Users can work from a final annual result down to intermediate loss terms and monthly behaviour instead of treating the PV yield calculation as a black box.
¶ Solar-resource data in the same environment
Historical time series, TMY datasets and probabilistic resource products can feed directly into the same environment used for PV yield calculations.
Selected LuciSun solar datasets also support sub-hourly resource analysis down to approximately 10-minute resolution.
¶ Soiling and snow assessment
Dedicated LuData services are available where operational losses need to be assessed rather than imposed as a fixed assumption.
The interface can expose:
- HSU soiling assessment;
- Kimber soiling assessment and cleaning scenarios;
- Köppen-Geiger screening;
- dedicated snow-loss modelling.
For this benchmark, the annual reference soiling and snow losses were intentionally aligned rather than using the LuData automatic assessment methods. This keeps the benchmark focused on the modelling stages intended for comparison.
¶ Repeatable and portfolio-scale workflows
Once an engineering protocol has been established, the same capabilities can be called programmatically through the API to:
- screen multiple sites consistently;
- compare design variants, DC/AC ratios, layouts and inverter configurations;
- automate sensitivity and prefeasibility studies;
- generate standardized results across a portfolio;
- integrate PV yield outputs into internal products or downstream systems.
¶ From historical resource to forward-looking workflows
LuData is also being extended toward numerical weather prediction and forward-looking PV production workflows, creating a continuous path from historical resource assessment to yield and forecast within the same ecosystem.
¶ Reproducibility and collaboration
Because LuData is cloud-based, project configurations and results can be reused across teams, supporting:
- consistent engineering logic across UI and API workflows;
- reproducible configurations and scenarios;
- scenario history and versioning;
- collaboration across engineering, product, development and investment teams;
- direct integration of modelling outputs into downstream digital systems.
¶ Detailed modelling approach
¶ LuData modelling choices used in these benchmark runs
Across the three sites, LuData uses:
- Diffuse horizontal decomposition: Erbs
- Plane-of-array transposition: Hay
- Row / inter-array shading: calculated from array geometry
- Near-object shading: separate project-specific contribution where required
- Far horizon: calculated from a horizon profile
- Cell temperature: PVsyst-family thermal formulation with project-specific thermal coefficients
- Irradiance-level behaviour: LuData module-performance model
- Inverter conversion: generic inverter-efficiency model parameterised from available inverter characteristics
- Inverter clipping: calculated from the inverter AC power limit
- Final PV production and PR: calculated through the LuData simulation chain
The PVsyst reference uses Perez transposition for Sites A and C and Hay for Site B.
¶ How to read the loss comparisons
LuData and PVsyst do not always expose losses with the same terminology or level of aggregation.
The benchmark therefore compares effects according to their physical meaning and position in the energy-conversion chain, rather than assuming that similarly named loss categories are always mathematically identical.
For each case below:
- the annual result table gives the main numerical comparison;
- the cumulative annual loss chain gives the clearest visual overview of how the two simulations progress toward the final PR;
- the monthly comparison checks whether the annual agreement is also reflected through the year;
- the detailed annual loss comparison shows where individual loss terms differ.
The cumulative loss-chain figures are an illustrative mapping of annual effects. They are useful for comparing the overall loss structure, but should not be interpreted as an exact reconstruction of either software's internal calculation order. The reported annual PR remains the reference final performance indicator.
¶ How to interpret this benchmark
¶ This is a model-to-model comparison
PVsyst is used as an established engineering reference, not as measured ground truth.
Agreement with PVsyst demonstrates consistency with a widely used engineering modelling workflow. It does not, by itself, establish absolute predictive accuracy.
¶ Some assumptions are intentionally aligned
Selected project assumptions such as soiling, IAM, LID, mismatch, wiring, transformer and availability effects are aligned where they are directly transferable and where doing so improves comparability.
Agreement for those terms is therefore partly by construction.
The most informative elements are the quantities calculated independently by the two modelling chains, including:
- irradiance transposition;
- geometrical shading;
- irradiance-level behaviour;
- thermal response;
- inverter conversion and clipping;
- final energy production and PR.
¶ Differences are retained rather than tuned away
The objective was not to calibrate LuData until every intermediate output reproduced PVsyst.
Where the tools use different physical models, taxonomies or aggregation approaches, the differences are retained and interpreted.
¶ Scope
The benchmark covers three materially different utility-scale configurations, but it does not represent every:
- climate;
- module technology;
- inverter architecture;
- bifacial configuration;
- plant layout.
The results should therefore be interpreted as evidence of strong alignment across the configurations assessed.
¶ Next evidence layer: measured PV data
This benchmark compares LuData with an established engineering modelling reference.
A complementary validation phase is intended to compare LuData simulations with quality-controlled measured irradiance and PV production from operating systems, using documented plant configurations, consistent assumptions and defined data-quality rules.
| Current benchmark | Next evidence layer |
|---|---|
| LuData vs PVsyst | LuData vs quality-controlled measured PV data |
| Consistency with established engineering modelling practice | Performance against observed plant behaviour |
These are complementary layers: model-to-model consistency first, then comparison against measured plant behaviour.
¶ Definitions
| Term | Definition used on this page |
|---|---|
| ΔE [%] | (E_LuData − E_PVsyst) / E_PVsyst × 100 |
| ΔYf [%] | (Yf_LuData − Yf_PVsyst) / Yf_PVsyst × 100 |
| ΔPR [pt] | PR_LuData − PR_PVsyst, expressed in percentage points |
| Monthly energy nMAE | Sum of absolute monthly energy differences divided by total PVsyst annual energy |
| Monthly PR MAE [pt] | Mean absolute monthly difference between LuData and PVsyst PR, expressed in percentage points |
| GHI | Global horizontal irradiation [kWh/m²] |
| GTI | Global tilted / plane-of-array irradiation [kWh/m²] |
| PR | Performance ratio |
| Yf | Specific yield [kWh/kWp] |
| TMY | Typical Meteorological Year |
| NWP | Numerical Weather Prediction |
¶ Document information
- Document: LuData PV Yield Benchmark
- Reference:
LUDATA-PVY-BENCH-2026-01 - Version: 1.0 — External release
- Issue date: 20 August 2026
- Publication status: Public release
PVsyst is used solely as an industry reference for objective comparison. LuciSun and LuData are independent from PVsyst and its publisher; the benchmark is not sponsored, endorsed, certified or approved by them.
The results are provided for technical evaluation and benchmarking purposes and do not constitute certification, lender acceptance, investment advice or a guarantee of actual plant performance.