This page explains how LuData pricing works, how usage is measured,
and how users can monitor and control their consumption across both the Web UI and the REST API.
The objective is to provide a pricing model that is:
- transparent
- predictable
- aligned with engineering workflows
- compatible with procurement, budgeting, and audit requirements
This page should give you everything you need to understand what you pay for, how consumption is measured, and how to stay in control.
¶ Overview
LuData pricing is based on annual capacity, expressed in sites per year.
Each plan includes:
- Access to the LuData Web Interface
- Access to the LuData REST API
- A defined annual usage capacity
- A usage dashboard to monitor consumption in real time
Users do NOT pay per click, per execution, or per API call.
Instead, capacity is consumed progressively based on the amount of data requested.
This ensures:
- no surprise billing
- no hidden costs
- full predictability over a yearly horizon
¶ Key concept — What is a request?
A request (also referred to as a credit) is the atomic unit used to measure usage.
Requests are not arbitrary counters.
They are directly tied to data volume and historical depth.
¶ Requests for Historical Time Series & TMY services
For the following services:
- Historical Time Series Data (HTSD)
- Typical Meteorological Year (TMY)
the consumption rule is:
1 request = 1 variable over 1 year
¶ Practical examples
| Request | Consumption |
|---|---|
| GHI over 10 years | 10 requests |
| GHI + Tamb over 5 years | 10 requests |
| 8 variables over 20 years | 160 requests |
This model ensures that:
- small exploratory studies remain lightweight
- long historical analyses are fairly accounted for
- usage scales linearly with the amount of data requested
- users always understand what drives consumption
¶ Requests for Digital Elevation & Horizon services
Terrain-related services use a fixed request cost per call based on complexity.
| Service | Request consumption |
|---|---|
| Elevation — point | 1 request |
| Elevation — area | 1 to 4 requests (depending on grid resolution) |
| Horizon profile | up to 4 requests |
These services are:
- independent of time depth
- independent of satellite availability
- deterministic in cost
¶ The Site Unit reference
To normalize usage across services, LuData defines an internal reference called a Site Unit.
A Site Unit represents:
- a single geographic site
- queried using the maximum available historical depth
- across all available variables
In practice:
- a fully exploited site typically corresponds to ~800 requests
- this value is used to normalize and provide size plans and capacity bundles.
Users do not need to manage Site Units manually.
This reference exists to:
- make pricing consistent across use cases
- ensure fairness between short and long studies
- simplify capacity planning for customers
¶ Plans and annual capacity
LuData plans are defined by how many sites can be processed per year.
Typical plans include:
- Trial (small validation and testing)
- Starter
- Growth
- Pro
- Enterprise (custom capacity and contractual terms)
All plans provide:
- the same data quality
- the same services
- the same UI and API access
The only difference between plans is how much annual capacity is included.
This design allows procurement teams to budget in advance
without uncertainty on execution cost.
¶ Enterprise & Platform License
¶ Enterprise plans
Enterprise plans are contract-based and designed for:
- large organizations
- automated or batch pipelines
- audit and compliance requirements
- SLA and support constraints
Enterprise plans may include:
- custom annual capacity bundles
- multi-user organizations
- specific exceed policies (hard stop, top-up, or overage)
- contractual documentation and SLAs
¶ Platform License (embedded applications)
If LuData is:
- embedded inside your own product
- queried on behalf of multiple end users (OEM / B2B / B2B2B) and also fast enough to be used by more recent Large Language models.
a Platform License applies.
This includes:
- an organization-level account
- UI and API access
- a shared annual capacity bundle
- a defined usage policy
- optional SLA and private deployment
Capacity is sized jointly with Lucisun based on expected usage patterns.
¶ Account activation & access
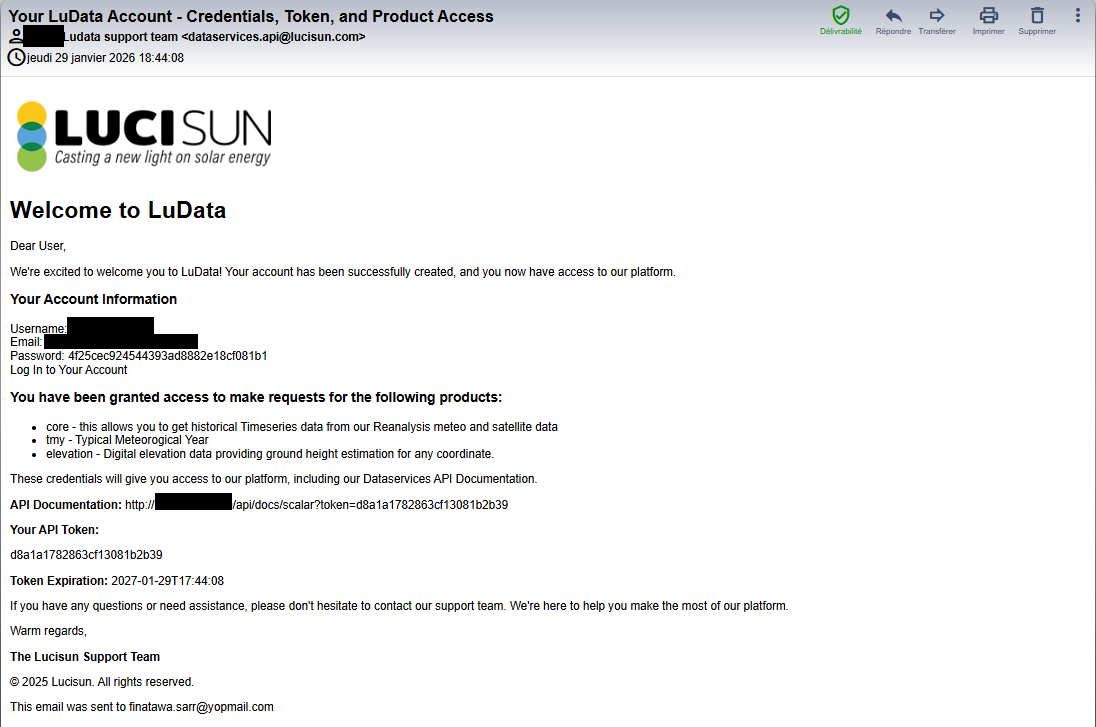
Once a plan is purchased (online or via sales), users receive an account activation email.
This email contains:
- LuData login credentials
- access to the LuData Web Interface
- access to the API documentation
- a personal API token
- token expiration information
- the list of enabled services (HTSD, TMY, Elevation)
Welcome email containing credentials and API token.
From this point, users can immediately start exploring the UI and API.
¶ API token policy
Each user account has:
- one active API token
- the token is shared across all scripts, applications, and integrations
¶ Token regeneration
Users may regenerate their API token from the dashboard.
Important:
- regenerating a token immediately invalidates the previous one
- all scripts, applications, and integrations must be updated
- the old token stops working instantly
This policy ensures:
- security
- traceability
- clear ownership of API usage
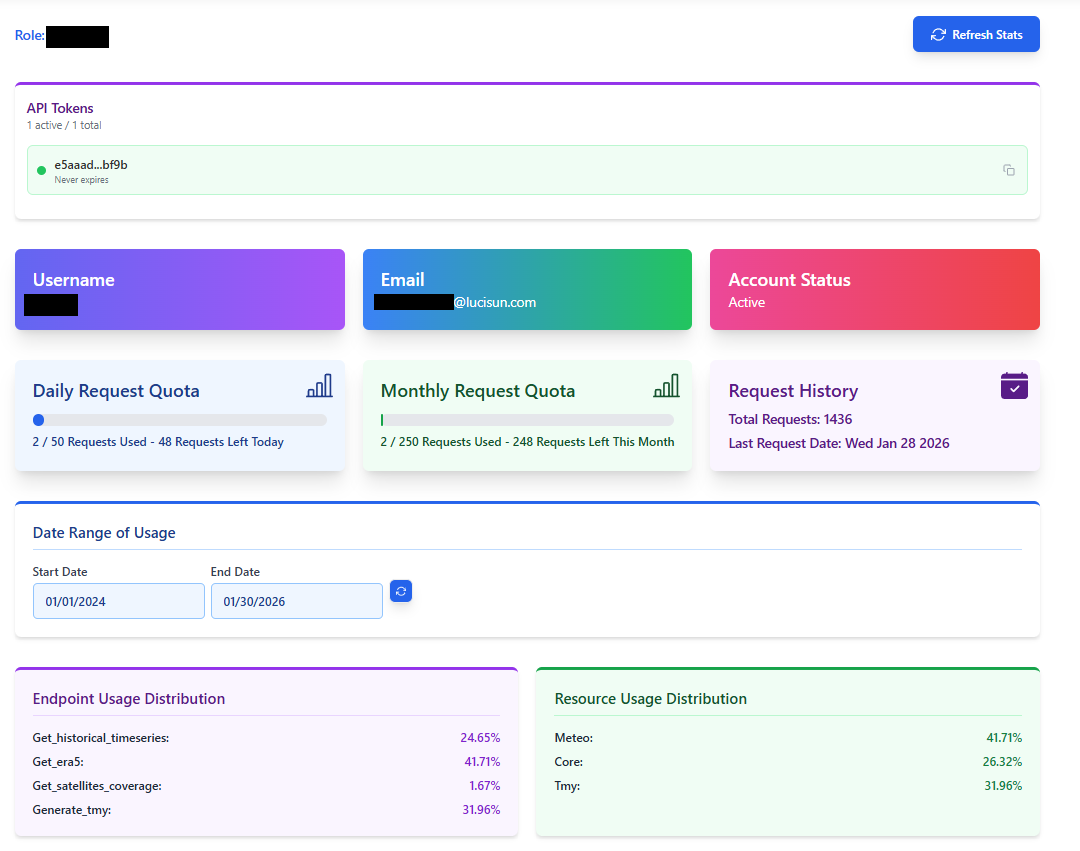
¶ Monitoring usage — User dashboard
All users have access to a Usage Dashboard, available from (see the tab bar of the platform):
Resources > User Stats Dashboard
The dashboard provides:
- current plan and account status
- active API token
- daily and monthly request quotas
- total historical usage
- usage breakdown by:
- service
- endpoint
- resource type
User dashboard showing quotas and usage distributions.
Detailed explanations of the dashboard indicators are provided in the User Manual.
¶ Why usage tracking matters
Usage tracking allows:
- teams to plan studies over the year
- organizations to avoid unintentional overconsumption
- fair allocation of infrastructure resources
- prevention of abusive or unintended usage
The system is designed to be:
- transparent
- predictable
- aligned with engineering and data workflows
¶ Good practices
To make optimal use of your plan:
- reuse sites and scenarios when possible
- avoid requesting unnecessary variables
- monitor usage trends regularly
- plan large studies early in the billing period. Our Enterprise plan and License model is however here in case you have uncertainties and allow you to have some capacity block added and to lift the limits for users.
For questions related to pricing, capacity, or procurement constraints,
contact dataservices.api@lucisun.com.
¶ Summary
LuData pricing is:
- based on annual site capacity
- measured using requests tied to data volume
- fully visible through the usage dashboard
- consistent across UI and API workflows
This approach ensures clarity for engineers, analysts, procurement teams, and auditors.