¶ Working with Sites & Scenarios
This section explains how users interact with LuData once logged into the platform.
It describes how to:
- Define sites
- Configure and run scenarios
- Access and manage results
- Reuse existing analyses efficiently
The same workflow applies whether LuData is accessed through the web interface or via APIs.
This section focuses primarily on the web interface.
¶ Accessing the Scenario Generator
After login, users access LuData services through the Scenario Generator, available from the Lucisun Catalog in the main navigation.

The Scenario Generator is the central interface used to:
- Define a site
- Select a service
- Configure how the service should be executed
- Generate and create a scenario
The workflow is structured into two main steps:
- Site definition
- Scenario definition
¶ Step 1 — Defining a Site
The first step consists of defining a site, which represents the physical geographic location of the analysis.
A site is created once and can be reused across multiple scenarios and services.
¶ Site information
Users are required to:
- Provide a site name
- Define the geographic coordinates (latitude and longitude)
A map interface allows users to visually locate and adjust the site position.

Placeholder — Suggested image: Step 1 showing site name, coordinates, and interactive map.
¶ Altitude definition
Depending on the selected service, the site altitude can be:
- Entered manually by the user, or
- Automatically retrieved through the interface using elevation data
The automatic altitude retrieval is available directly from the UI and does not require additional configuration.
¶ Service selection
At this stage, users select the service they intend to use, such as:
- Historical Time Series Data
- Typical Meteorological Year (TMY)
- Digital Elevation & Horizon
The selected service determines the configuration options available in the next step.
Once the site and service are defined, users proceed to Step 2.
¶ Step 2 — Defining a Scenario
A scenario describes how the selected service should be applied to the site.
Each scenario is independent and allows users to:
- Compare assumptions
- Test different configurations
- Avoid re-running identical analyses
Multiple scenarios can be created for the same site, even across different services.
¶ Scenario information
Users provide:
- A scenario name
- An optional scenario description
This information is used to identify scenarios in the interface and in the scenario history.
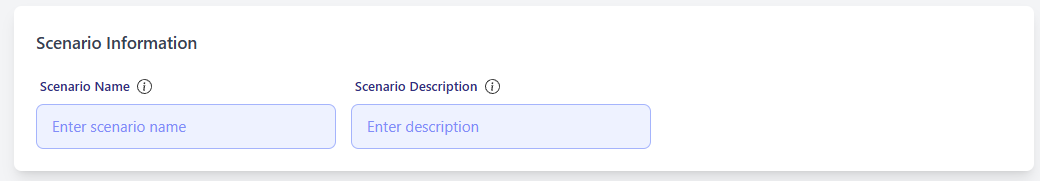
scenario name and description fields.
¶ Common scenario configuration
Some configuration elements are shared across multiple services.
¶ System configuration
Depending on the selected service, users may define:
- Mounting type (e.g. fixed, single-axis, dual-axis)
- Geometric parameters such as surface tilt and azimuth
These parameters are required for services that depend on system geometry (e.g. solar-related services).
¶ Output configuration
Users can define how results should be delivered:
- Output format (CSV, JSON, or service-specific formats)
- Output timezone (UTC or local time)
- Time convention (e.g. start or end of interval)
- Data granularity (where applicable)
These options control how the data is structured and interpreted downstream.
¶ Service-specific configuration
In addition to common fields, each service exposes service-specific configuration options.
¶ Historical Time Series Data (HTSD)
When selecting the Historical Time Series Data service, users can configure:
- Time period (start and end dates). We are automatically providing you the boundaries of the available start and end date.
Through the API docs, users can exploit for any location on eath that we cover to asses what is the best available satellite proposed and the boundary in time that we have available. This is available through the API via the endpoint : /core/get_satellites_coverage. Via the UI, user can have this automatically with boundaries set up when site is selected. - Irradiance variables (e.g. GHI, DNI, DHI, GTI, etc)
- Meteorological variables (e.g. temperature, wind, humidity, precipitation, etc)
Users can freely select the variables required for their analysis.
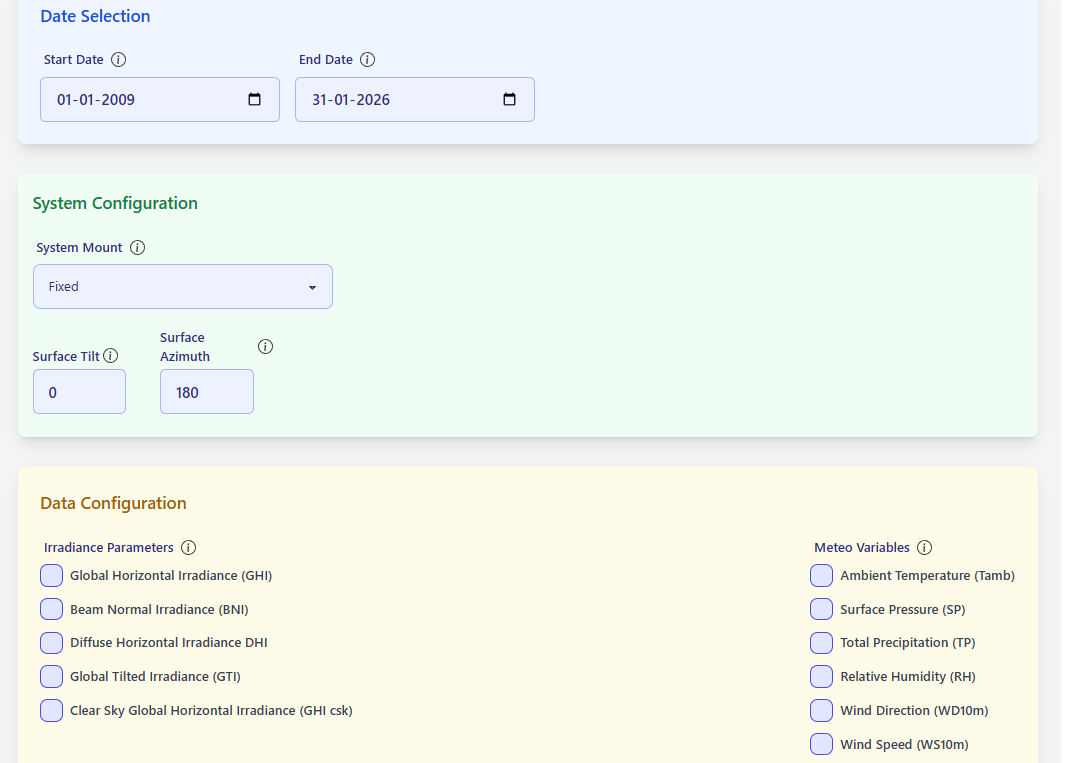
HTSD scenario configuration with variable selection.
¶ Typical Meteorological Year (TMY)
When selecting the TMY service, additional configuration options become available:
- Technology type (e.g. PV, CSP, CPV, tracker-based systems)
- Selection of one or multiple TMY percentiles (e.g. P50, P75, P90, PXX)
Mandatory variables required for TMY generation are automatically pre-selected and cannot be removed.
Optional variables can be added by the user.
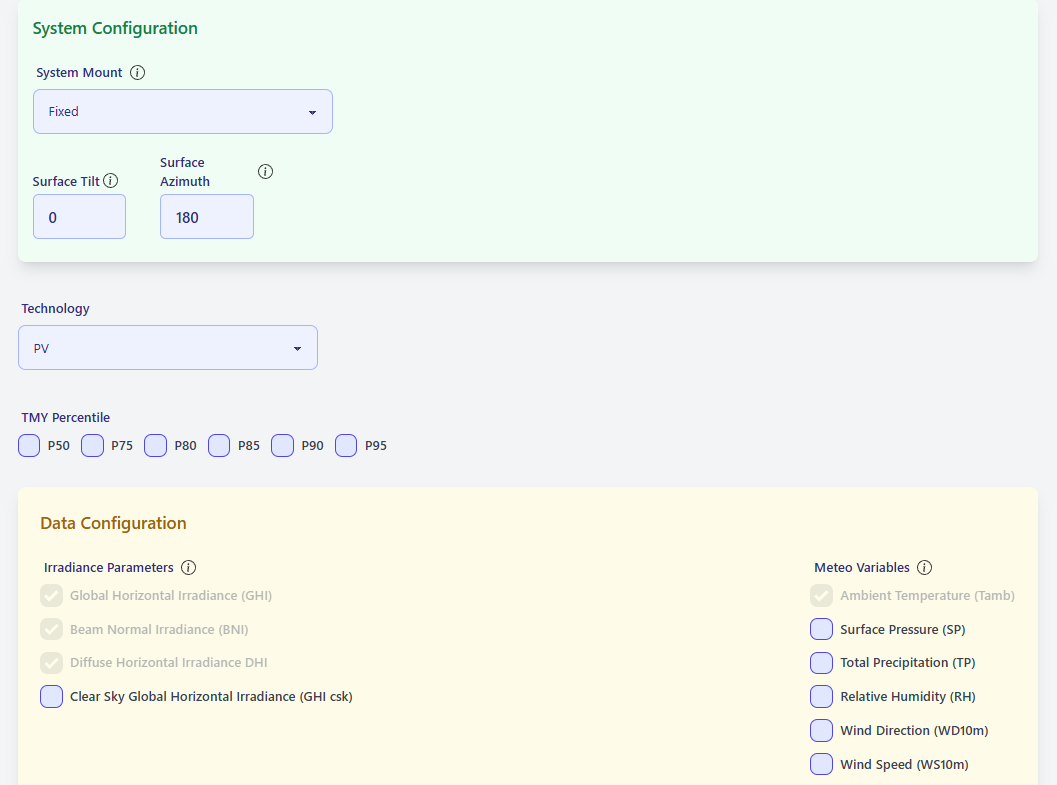
TMY configuration showing technology and percentile selection.
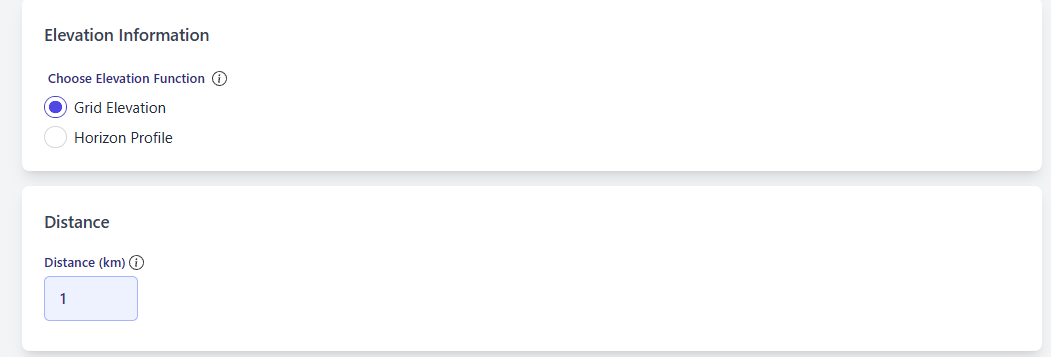
¶ Digital Elevation & Horizon
The Digital Elevation & Horizon service provides elevation-related outputs for a site and its surroundings.
Users can choose between:
- Grid Elevation: elevation data over a square or box area around the site
- Horizon Profile: horizon relief as a function of azimuth
Additional parameters include:
- Distance from the central site (in kilometers)
- Azimuth step (for horizon profiles)
- Observer height
These analyses are critical inputs for solar modelling and other applications sensitive to terrain and horizon obstructions.
¶ Elevation service showing grid elevation and horizon profile options
| Grid Elevation | Horizon Profile |
|---|---|
 |
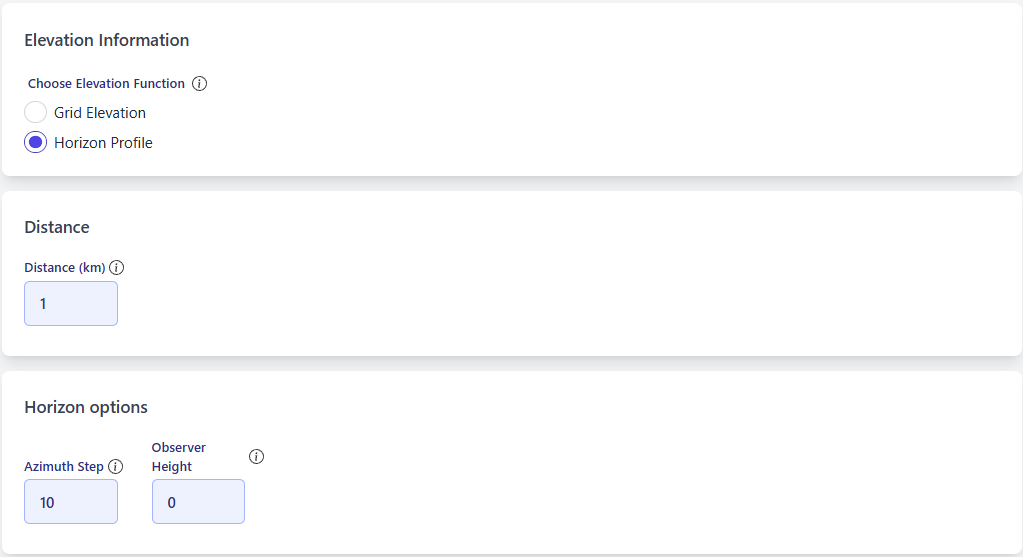 |
Elevation service showing grid elevation and horizon profile options.
¶ Tooltips and guidance
Throughout the Scenario Generator, tooltips are available next to most fields.
Users are encouraged to consult these tooltips to obtain:
- Detailed explanations
- Parameter definitions
- Expected impacts on results
If information is missing or unclear, users are invited to contact Lucisun (support@lucisun.be or info@lucisun.be).
Frequently asked questions are progressively added to the documentation and FAQ.
¶ Running a scenario
Once the scenario configuration is complete, users can launch the scenario execution.
Each execution of a scenario (not creation of scenario):
- Triggers the selected service
- Produces a set of results associated with the scenario
- Consumes capacity according to the user’s contract
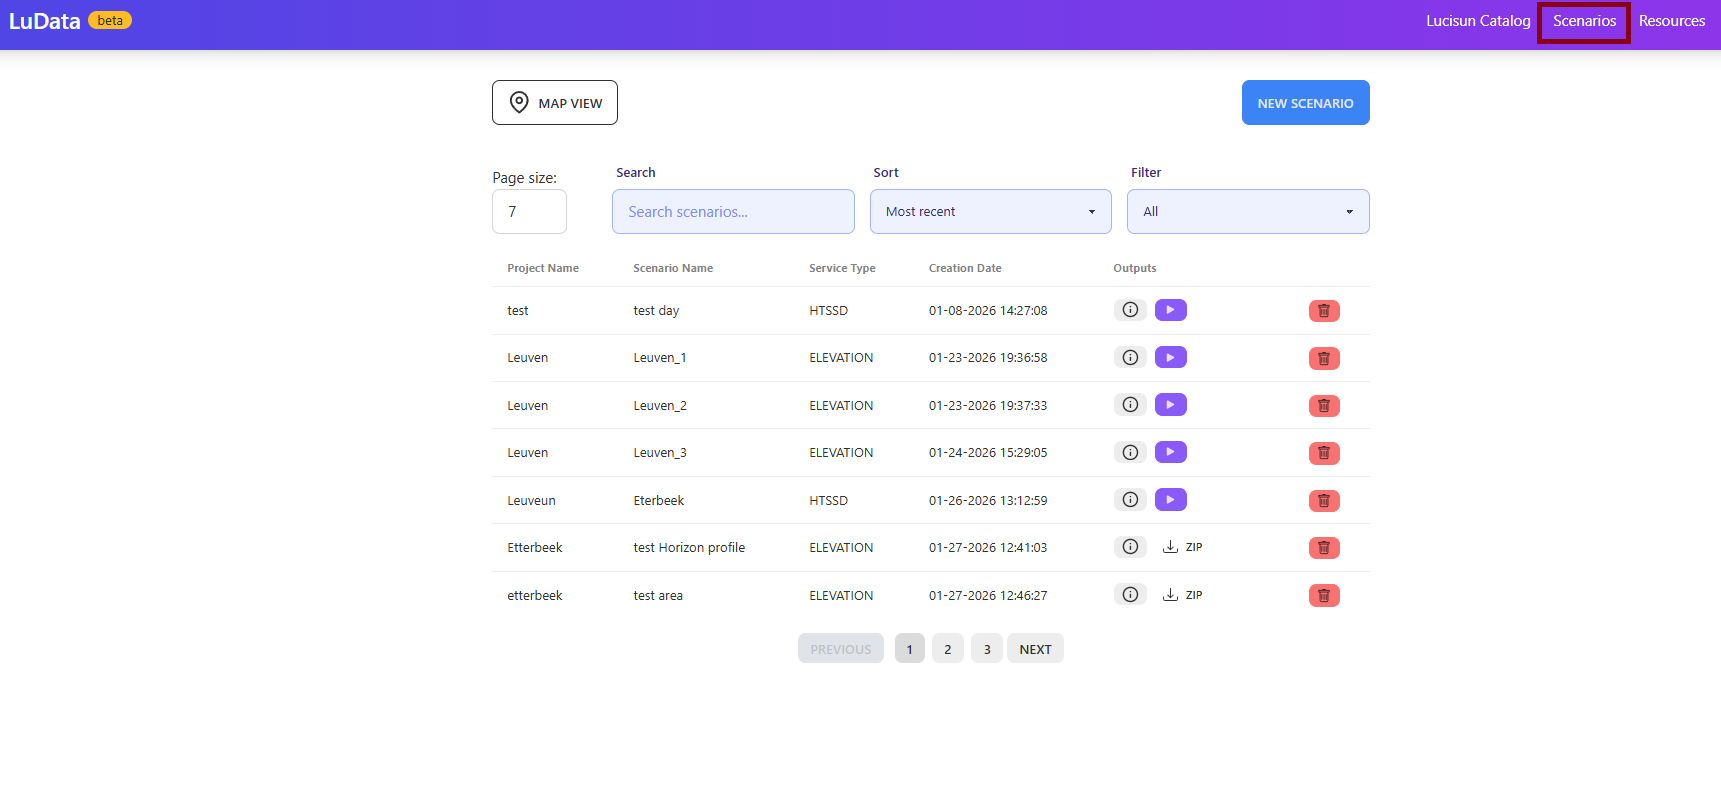
¶ Accessing results
Results are delivered as a compressed archive (.gzip) containing:
- Requested data outputs
- Associated metadata
Results are accessible:
- Directly from the scenario interface
- Via the scenario history linked to each site
User can visualize scenarios ran and the one unrun.
Users can visualize if previously scenarios where ran for a site using the feature where we aggregate scenarios per coordinate.
| List view scenarios | Map view scenarios |
|---|---|
 |
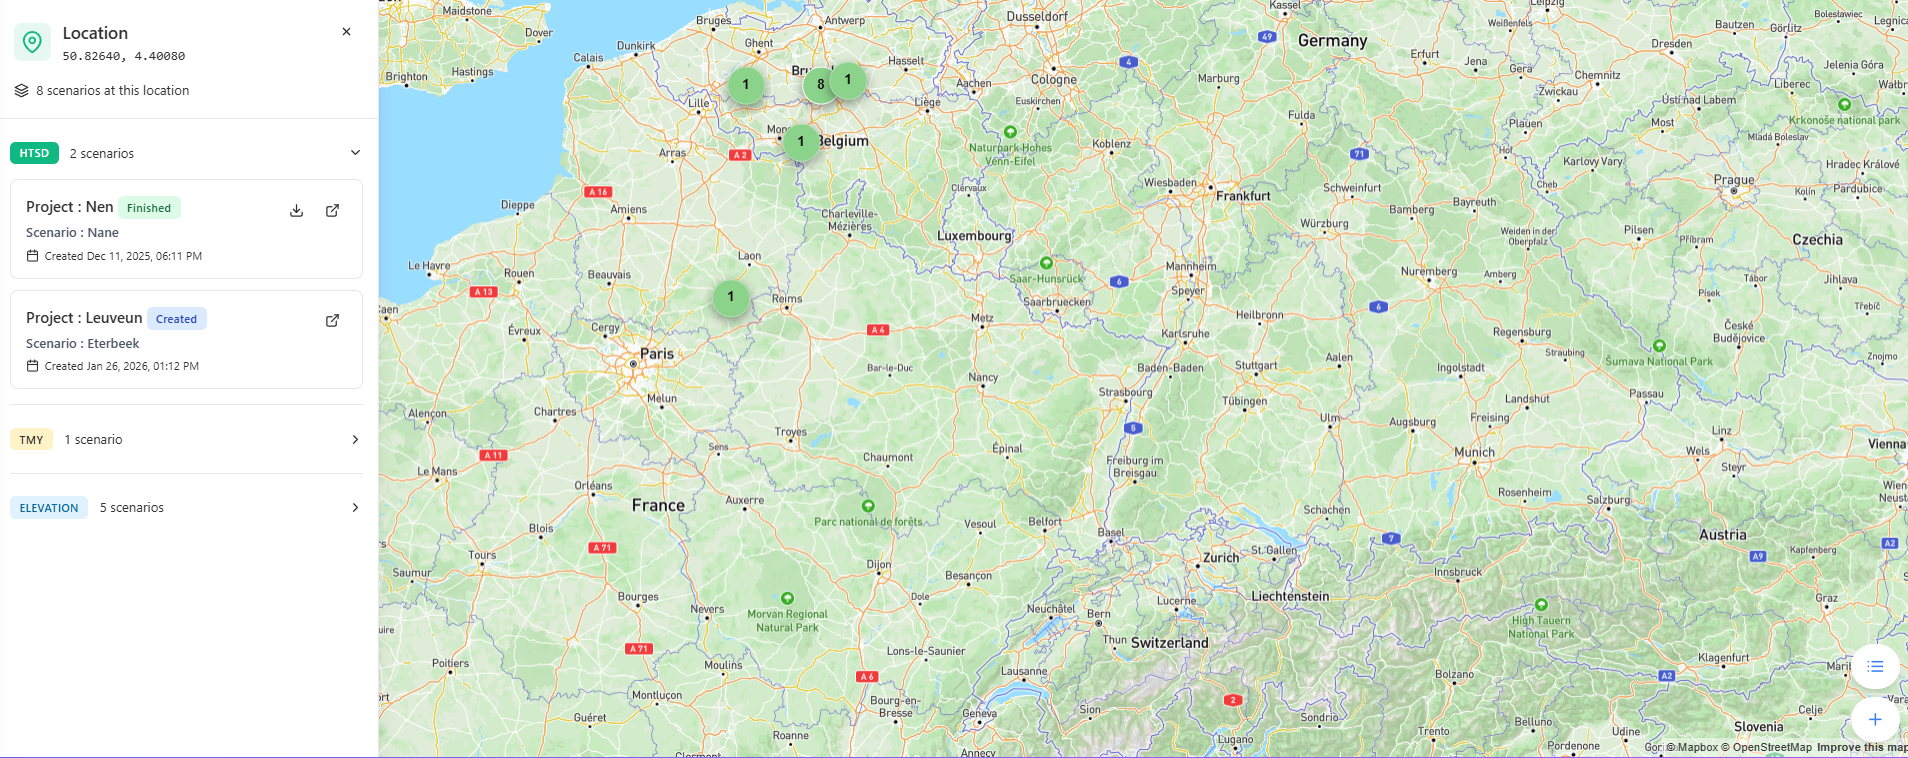 |
Scenario results view and download action.
¶ Managing scenario history
LuData keeps track of all scenarios executed for each site.
This allows users to:
- Review previously generated results
- Avoid repeating identical analyses and can visualize all scenarios through a world map
- Compare scenarios with different assumptions
Scenario history is organized per site, providing a clear overview of all analyses performed.
¶ Good practices
To make efficient use of LuData:
- Reuse existing sites and scenarios when possible
- Use scenario naming conventions that reflect assumptions and time periods
- Avoid launching duplicate scenarios with identical configurations
- Use scenario history to compare results instead of re-running services
These practices help optimize usage and ensure consistent analysis workflows.
¶ Summary
The LuData workflow follows a clear and consistent structure:
- Define a Site
- Select a Service
- Configure a Scenario
- Run the scenario
- Retrieve and manage results
All services follow this common logic, with service-specific configuration applied where required.
¶ User Dashboard
The User Dashboard provides a consolidated view of a user’s account status API access and resource consumption.
It is the primary place where users can:
- Verify their account and API access
- Monitor daily and monthly request usage
- Understand how LuData services consume requests
- Detect abnormal or unintended usage
- Ensure compliance with plan limits and fair use policies
The dashboard is accessible from:
Resources > User Account Dashboard
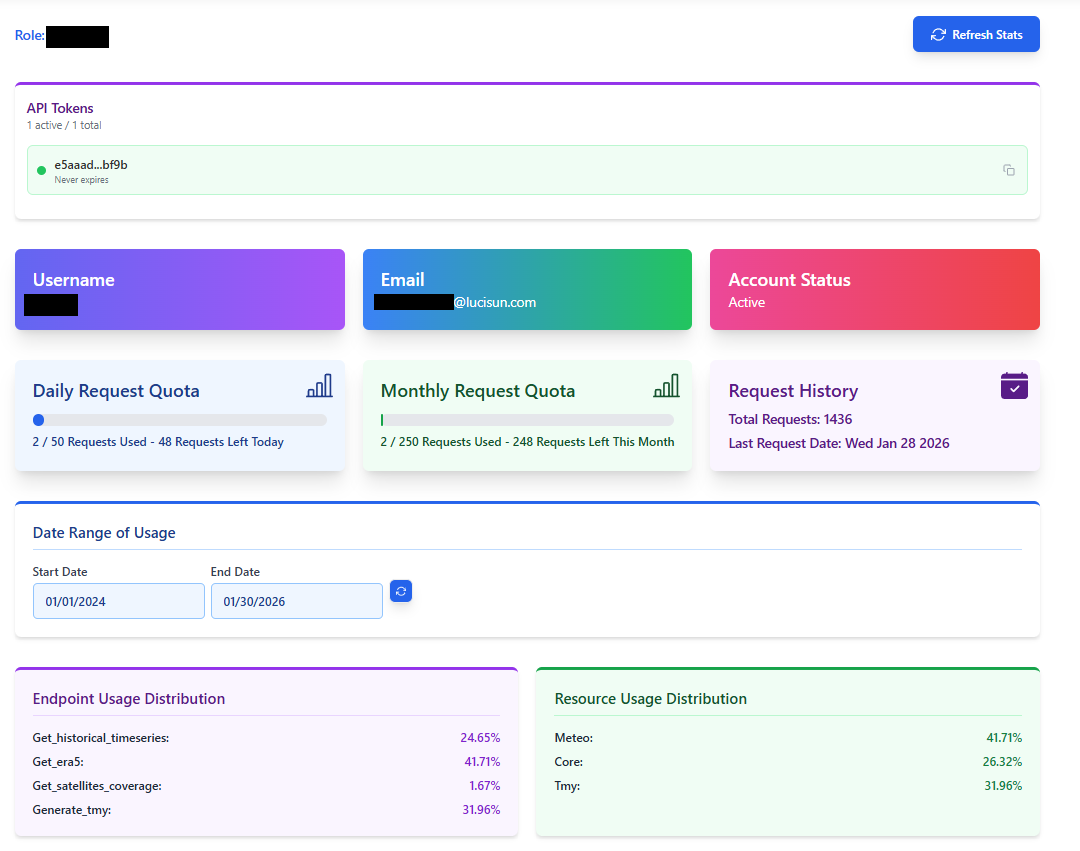
Full User Dashboard showing quotas and usage distributions.
¶ Account and API access
¶ Account information
The top section of the dashboard displays:
- User role
- Username
- Email address
- Account status (active / inactive)
This information allows users to quickly verify that the correct account and permissions are being used.
¶ API token management
LuData uses a single API token per user account.
Key principles:
- Only one active API token can exist at any time
- The token grants access to all authorized LuData services via the REST API
- The web interface does not require an API token but is using the user's token to do the request on his behalf (and therefore counted every time a call is exevuted).
- Organisations through the Enterprise plan or License Model Plan can request to have multiple users but still even every user will have access to one single token that can be regenerated.
¶ Token regeneration
Users may regenerate their API token if needed (for example, if the token is compromised).
⚠️ Important consequences of regeneration:
- The previous token is permanently revoked
- All applications, scripts, and integrations using the old token will immediately stop working
- Users must update the new token in all environments, including:
- Applications
- Automation scripts
- Scheduled jobs
- Third-party integrations
Token regeneration should therefore be performed only when necessary, and with care.
¶ Request quotas
LuData operates on a request-based consumption model (Site based equivalence available to ease decisions for stakeholders and companies management).
Requests are the unit used for usage tracking, plan limits, and billing.
The dashboard displays both daily and monthly request quotas.
¶ Daily request quota
The daily quota shows:
- Requests used today
- Remaining requests for the current day
- Daily limit defined by the user’s plan
Daily limits help:
- Prevent accidental runaway usage
- Detect misconfigured automation early
- Protect platform stability
We do not usually apply such limits. This can be done if the customer requests it and can be edited for any user using one of our Fixed plans, Enterprise or License Model plan.
¶ Monthly request quota
The monthly quota shows:
- Requests consumed during the current billing period
- Remaining monthly allowance
- Monthly plan limit
Monthly usage is the primary reference for billing and plan enforcement.
¶ Request history summary
A summary panel displays:
- Total requests consumed since account creation
- Timestamp of the most recent request
This provides a quick confirmation of recent activity.
¶ Understanding what a request is
A request (sometimes referred to as a credit) is the fundamental unit used by LuData to measure usage.
The definition of a request depends on the service being used.
¶ Requests for Historical Time Series & TMY
For the following services:
- Historical Time Series Data (HTSD)
- Typical Meteorological Year (TMY)
The rule is:
1 request = 1 variable over 1 year
Examples:
- 1 variable over 10 years → 10 requests
- 4 variables over 5 years → 20 requests
- 8 variables over 25 years → 200 requests
The total request cost of a scenario depends on:
- Number of variables selected
- Length of the historical period
- Selected service (HTSD or TMY)
¶ Requests for Digital Elevation & Horizon services
Terrain-related services follow a different request logic:
| Service | Request consumption |
|---|---|
| Elevation – Point | 1 request |
| Elevation – Area | 1 to 4 requests (resolution-dependent) |
| Horizon Profile | Up to 4 requests |
These services are independent of temporal coverage.
¶ Site Unit reference
To provide a consistent reference across services, LuData defines a Site Unit.
A Site Unit represents the estimated maximum number of requests required to retrieve:
- All available variables
- Over the widest available historical period
- For a single geographic site
This reference value is:
800 requests per site
The Site Unit is used internally to:
- Normalize usage across services
- Estimate costs consistently
- Define plan limits and fair use thresholds
Users do not need to manage Site Units manually.
¶ Usage analysis
¶ Endpoint usage distribution
This section shows how requests are distributed across API endpoints, such as:
- Historical time series retrieval
- TMY generation
- Meteorological and reanalysis services
It helps users identify:
- Which operations consume the most requests
- Whether certain endpoints are overused
- Potential optimization opportunities
¶ Resource usage distribution
Requests are also grouped by service category, for example:
- Core services
- Meteorological data
- TMY generation
This provides a high-level view of how usage is allocated across LuData services.
¶ Why usage tracking matters
Usage tracking enables:
- Transparent cost control
- Fair use enforcement
- Early detection of misconfigurations or abuse
- Better planning of future needs
It benefits both users and the platform.
¶ Good practices
To use LuData efficiently:
- Reuse existing sites and scenarios
- Avoid running duplicate scenarios
- Monitor usage regularly via the dashboard
- Investigate unexpected usage spikes promptly
- Regenerate API tokens only when strictly necessary
¶ Summary
The User Dashboard provides a single, unified view of:
- Account and API access
- Request quotas
- Usage history
- Service and endpoint consumption
It is the primary tool for understanding, monitoring, and optimizing the use of LuData services.